Last updated on 01/08/2020
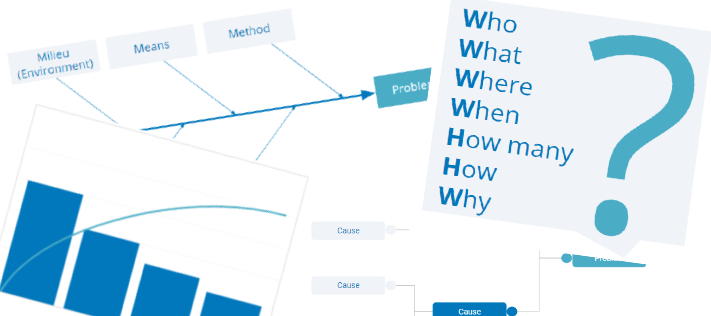
An occupational health and safety management system does not guarantee "zero accidents". When an incident occurs (an accident at work and/or an occupational disease), the Quality/EHS department has to adopt the right reflexes. This is achieved in particular by using Quality tools. Here are 4 of them specially designed to optimize the management of your accidents at work and occupational diseases.
The latest figures from Health Insurance are not going in the right direction. They indicate that the number of accidents at work has slightly increased in 2018 (+2.9% compared to 2017). With such dysfunctions, the right reflexes need to be adopted.
What are the Quality tools to be used to analyse the cause and avoid recurrences? We will answer that in this article. Here are, in order of priority 4 Quality tools to optimize the management of accidents at work and occupational diseases.
Tool 1: The Pareto Diagram
The first step is to determine the issues to be dealt with, using the Pareto Diagram.
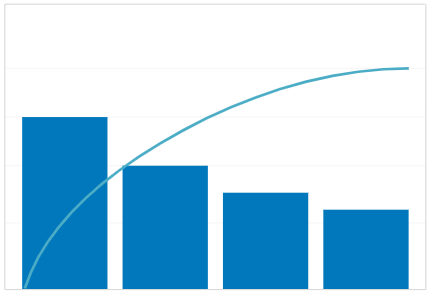
It is a visual tool that allows to identify the issues to be addressed as a priority by looking at figures (in particular the number of occurrences). Start by collecting all the figures, which you will then translate into percentages, then into cumulative percentages. Construct your diagram (abscissa: the items concerned; ordinate: cumulative percentage).
After having chosen the issue(s) to be addressed as a priority, there is a list of questions that will allow you to detail each of the identified problems in question.
Tool 2: List of questions

This list of questions allows the analysis of the different dimensions of a problem. It is all about answering the different questions listed above. This may seem like a simple tool to use, but you will need to be very rigorous when implementing it!
When the problem has been clearly articulated thanks using these questions, it will then be possible to identify the possible causes via the 5M diagram.

Tool 3: The 5M Diagram
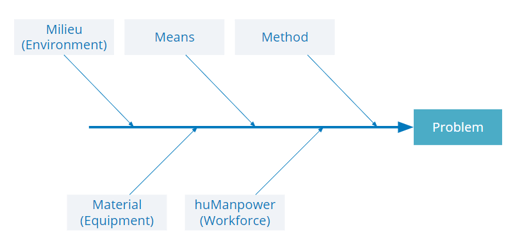
Also known as the fishbone diagram, Ishikawa diagram or cause and effect diagram, the 5M diagram is used to classify all possible causes of a problem. The identification of these causes is based on 5 criteria:
huMan power (Workforce); Milieu (Environment); Method; Means; Material
Articulate the problem using questions. In a brainstorming session, bring out all the possible causes. Only after you have made a list of all the causes, classify them into the 5 categories. You will then identify the causes to be tested as a priority, and then select the real (one and only one) cause.
Following the accident/incident, problems were identified as well as possible causes. In order to ensure that this does not happen again, an a posteriori approach must be put in place: the cause tree.
To go further on this method, I advise you to read a dedicated article on the subject: Good hygiene practices: use the 5Ms!
Tool 4: The Cause Tree
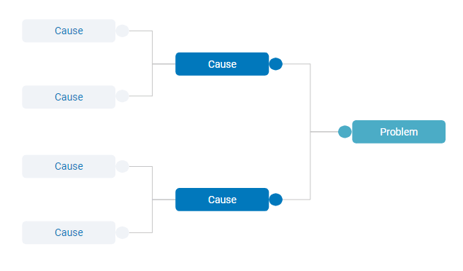
It is a graphical representation of the different causes that contributed to the accident/incident. The starting point is the observation/result and we go back step by step to the events that may have caused it. This study will allow to understand what happened in order to avoid any recurrence: since the accident/incident has already occurred, all we can do net prevention. In the field, collect information from witnesses, victims and collaborators in order to establish the chronology of events.
Before starting the cause tree, a multidisciplinary team will be set up to analyse the causes (the victim, witnesses, the“HSWCC” or Health, Safety and Working Conditions Committee, the EHS manager, the management, etc.). Solutions will then be sought and the associated corrective measures will be implemented.
And Think digital!
Thus, multiple software are available to help you in the management of your accidents at work and occupational diseases. Most of them are very visual and facilitate collaborative work. You can also use digital tools to implement these different methods: automatic generation of diagrams for the Pareto method, elaboration of flowcharts for the cause tree method, or provision of a digitized Ishikawa.
In addition to the analysis aspect of the accidents at work and occupational diseases, having a dedicated software tool for the management of its accidents at work and occupational diseases is an opportunity to save considerable time in the administrative processing, by avoiding double entries when filling in tax forms for example. Some solutions even make it way easier for you to declare and pay your social contributions online for example.
More:

. . .